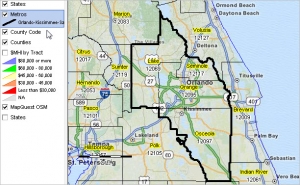
First off, I am not an economic expert by any means. However, I have the most basic understanding now of how to calculate economic base multiplier and how you can then project future employment in the area from taking CCIM CI 102 last week. It’s pretty neat to see how the numbers that the Bureau of Labor & Statistic equate into models and projections. Additionally, using that data, you can differentiate what sectors are a MSA’s core industries for base employment. Here is the geographic area for the Orlando MSA area.

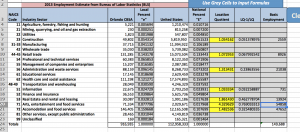
Here’s an example of 2013 Orlando MSA figures. The highlighted squares are more than 1.0 and therefore the sectors which make up base employment.

Below is how the economic base structure operates.

To learn more, watch my video blog this week (see below). And, I apologize in advance for the sound in a couple spots. I think my side ponytail hit the microphone. Sorry about that and I’ll know for next time.
